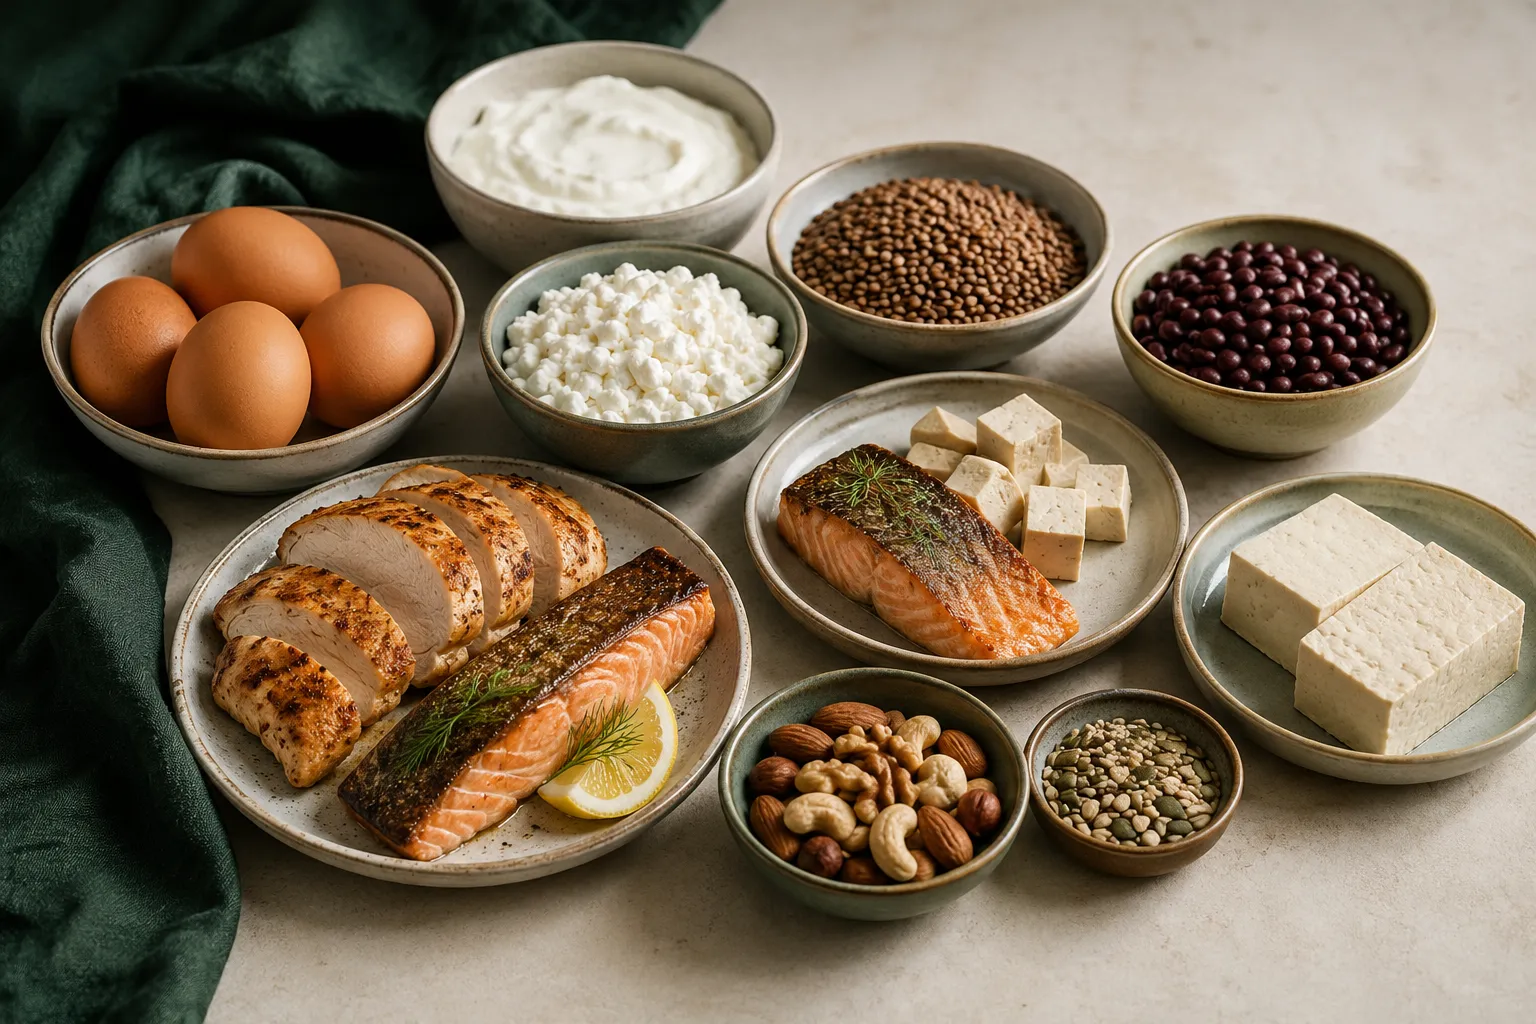
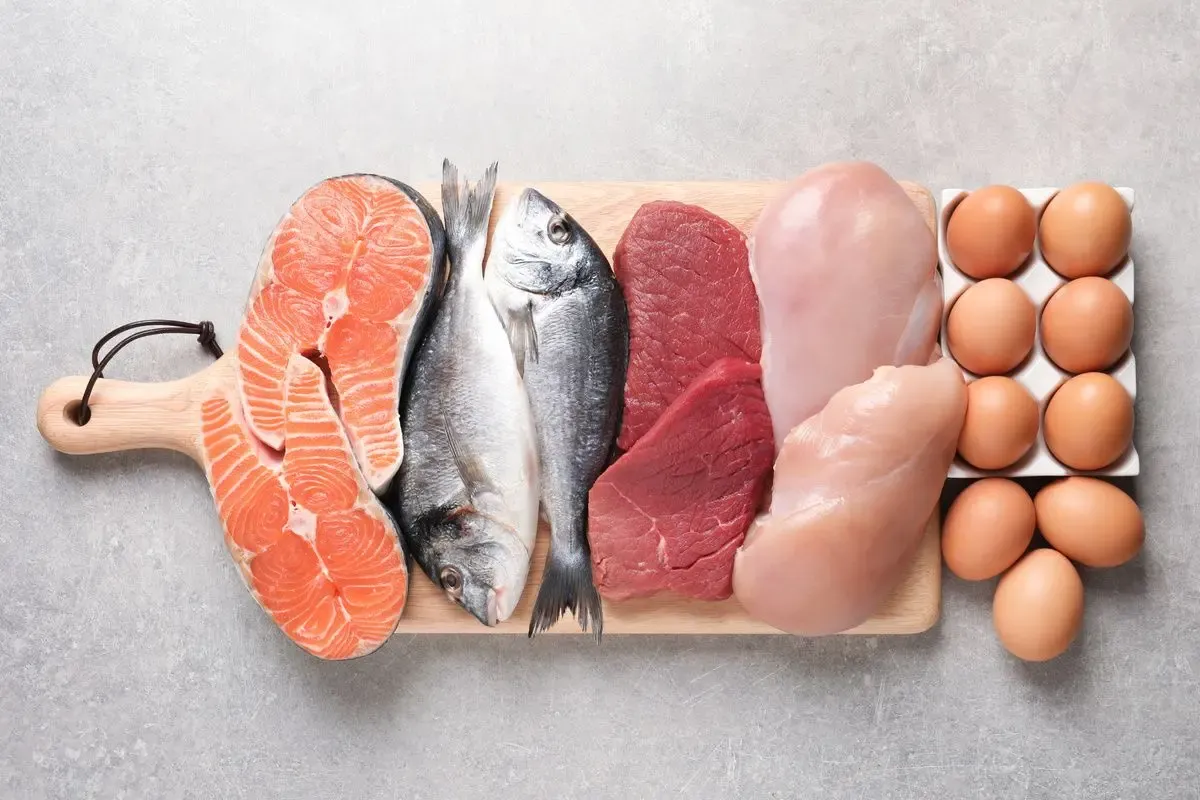
Protein foods in New Zealand: the useful way to compare them
There is no single “best protein food”. Chicken, tuna, eggs, tofu, lentils and beans are different foods with different ingredients, preparation methods and nutrient profiles. A useful comparison starts by asking a narrower question: what does this particular food record contain per 100 grams of edible food, in the state it is actually described?
That wording matters. Cooking changes water content. Draining a can changes the amount left to compare. A dry lentil and a cooked lentil are not like-for-like weights. Brand recipes can vary too. This guide uses a small set of named records from the New Zealand Food Composition Database (NZFCD), rather than presenting an invented ranking.
For help interpreting packaged-food labels, also read our guides to what “high protein” means in New Zealand and how to read a Nutrition Information Panel.
A small comparison of familiar foods
The table below reproduces selected NZFCD 2021 Concise Tables food-record names and protein values per 100 g edible portion. Food-family labels are Protein Notes editorial categories; the food records and figures are shown as published. The database terms apply to use of these data.
| NZFCD FoodID | Food record as published | Editorial group | Protein (g per 100 g edible portion) |
|---|---|---|---|
| M10040 | Chicken, breast, lean, fresh, baked or roasted, no fat or salt added | Poultry | 28.2 |
| K1006 | Tuna, canned in spring water, plain, salt added, drained | Seafood | 26.6 |
| M20 | Beef, mince, lean, stewed | Red meat | 23.9 |
| G1021 | Egg, chicken, whole, boiled | Egg | 14.6 |
| X1153 | Tofu, soy bean curd, regular, firm, simmered or pouched, no salt added | Soy food | 14.2 |
| X1250 | Bean, soy, (edamame), green, immature, shelled, frozen, boiled, drained, no salt added | Legume | 11.6 |
| X137 | Bean, black, boiled, drained, no salt added | Legume | 8.88 |
| X54 | Lentil, split, boiled, drained, no salt added | Legume | 7.63 |
| X1146 | Chickpea, canned in brine, drained | Legume | 7.23 |
Data note: the published NZFCD record name is part of the value. For example, the tuna record says drained, the chicken record says baked or roasted, and the legume records say boiled or canned in brine. Those details are why this is a comparison, not a generic list.
The Concise Tables are a 2021 quick-reference subset. FOODfiles 2024 is the newer full NZFCD release and includes many more records. Food composition values are reference values: they can vary with variety, season, recipe, brand and preparation. For the source data and its current terms, see the New Zealand Food Composition Database.
Why “per 100 g” is helpful — and where it can mislead
The per-100-g column makes the unit consistent. It is generally more useful than comparing random serving sizes printed on different packages.
But it is not a verdict. A cooked food can look more protein-dense than the raw version because cooking removes water. A dry pulse can look much higher than its cooked version because it later absorbs water. Canned foods can be compared meaningfully only when you notice whether the data refer to drained or undrained contents.
Use per 100 g to understand the density of the particular record. Then look at the state of the food, the recipe, the product’s own label, and the rest of the nutrients.
Animal and plant foods are not one-versus-one categories
Animal-source foods in the table include poultry, seafood, red meat and egg. Plant-source foods include soy foods and legumes. That is a description of origin, not a scorecard.
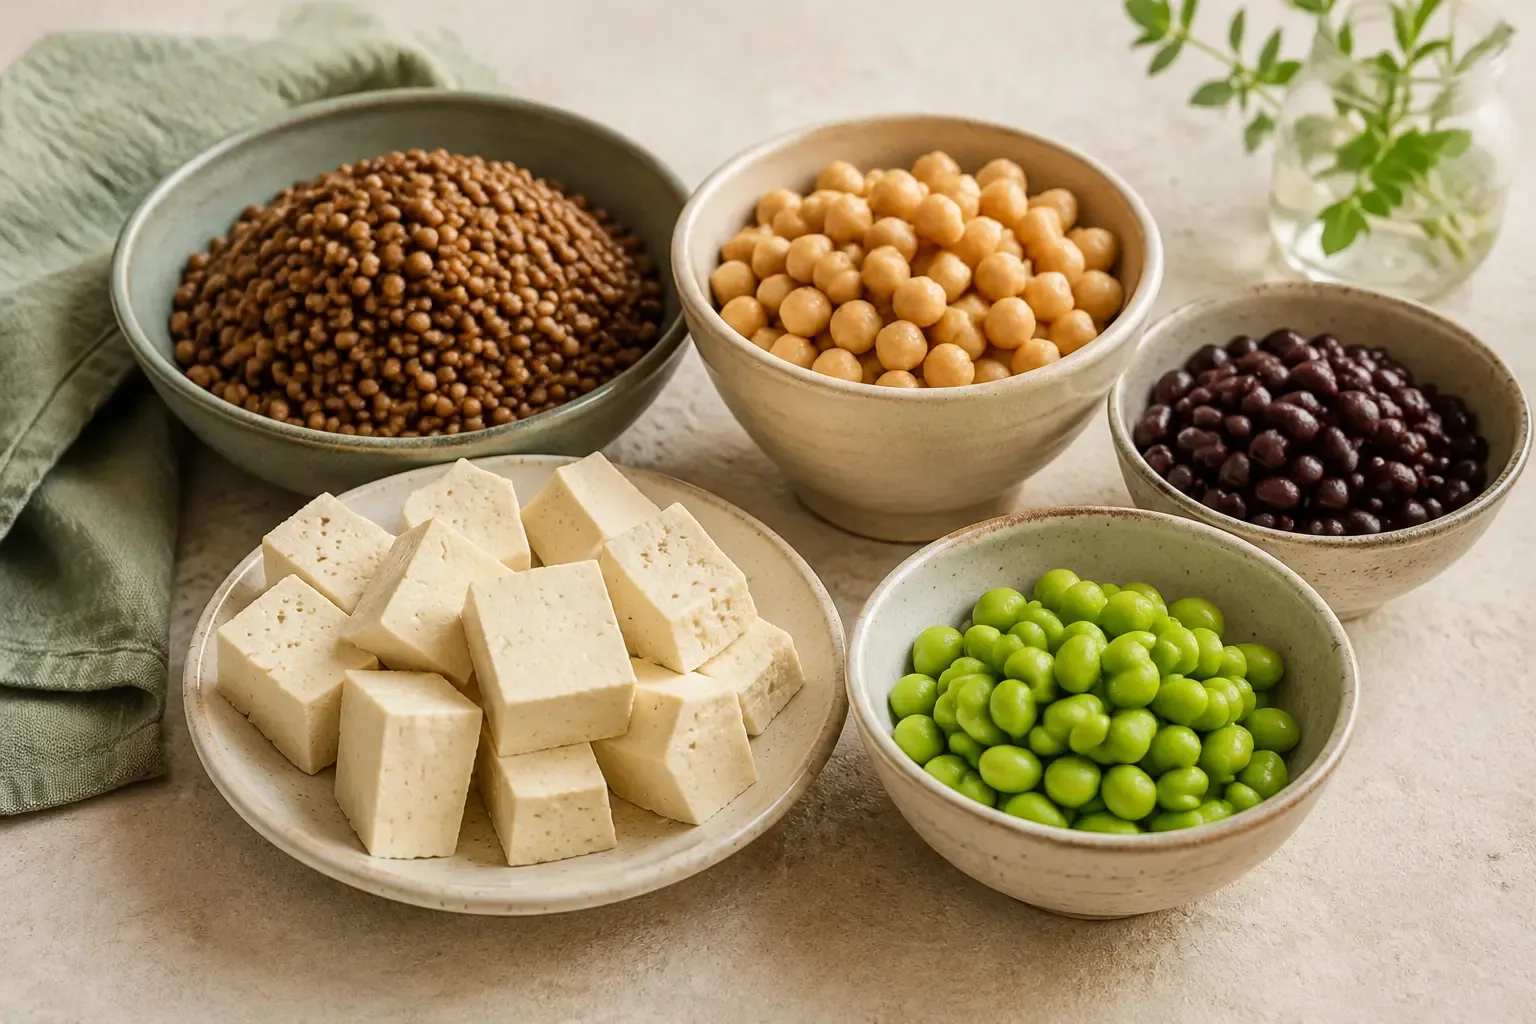
The plant entries here also bring dietary fibre, while the animal entries in this particular table show no dietary fibre. That does not make either group “better”; it shows why a protein number does not describe the whole food. Fat, fibre, sodium, carbohydrate, allergens, price, taste, culture and preparation all sit outside a single protein figure.
For packaged tofu, canned beans or flavoured fish products, use the current Nutrition Information Panel and ingredient list on the product in front of you. The database record is a reference, not a substitute for that label.
How to make a fair comparison at the shelf or in your kitchen
-
Name the food precisely. “Tuna” is not enough: oil, brine, water, drained and undrained records differ. The same is true for raw and cooked meat, or dry and cooked legumes.
-
Compare the same unit. Per 100 g is a consistent starting point. If a package also gives a serving, remember that serving sizes are set by the manufacturer.
-
Read beyond protein. A front-of-pack protein claim does not tell you the food’s ingredients, sodium, sugars, saturated fat or fibre. The Nutrition Information Panel guide explains where to find those details.
-
Keep categories separate. A food that is convenient, suitable for a particular diet, or easy to store can be useful for reasons that do not show up in a protein column.
-
Treat online lists carefully. If the preparation state or source is missing, you cannot tell whether two figures are directly comparable.
What this comparison does not say
This page does not prescribe how much protein any person should eat, recommend a food for a medical condition, or rank foods as “clean”, “best” or “worst”. Personal nutrition advice depends on circumstances that a general article cannot see. A New Zealand registered dietitian or appropriate health professional can help where an individual decision matters.
For the general framework used in New Zealand, see our source-linked note on how much protein people actually need.
Bottom line
Protein figures are most useful when they stay attached to a real food, a real preparation method and a real source. Compare foods per 100 g only after checking whether they are cooked, raw, canned, drained or otherwise prepared. Then read the rest of the panel or ingredient list before letting one nutrient claim do all the talking.
Frequently asked questions
Which food has the most protein per 100 g?
It depends on the exact food record and preparation method. In the selected NZFCD examples above, the baked-or-roasted chicken-breast record has the highest figure, but this is not a universal ranking of every food or product.
Are legumes lower in protein because they are plant foods?
The selected cooked legume records are lower per 100 g than the selected cooked meat or fish records, partly because cooked legumes contain much more water. They also differ in fibre and other nutrients. Compare named records and preparation states rather than treating a broad category as a single food.
Can I use the numbers on a product label instead?
Yes. For a packaged product, its current Nutrition Information Panel is the most relevant product-specific source. Per-100-g values help you compare two products with different serving sizes.
Why are the figures not the same as on another website?
The food may be raw rather than cooked, drained rather than undrained, a different cut or recipe, or a different database version. Nutrient data also vary between samples and over time.
Sources
- Concise New Zealand Food Composition Tables, 14th Edition — New Zealand Food Composition Database, 2021
- New Zealand FOODfiles 2024 — New Zealand Food Composition Database, 2024
- How to read food labels — Health New Zealand — Te Whatu Ora
- New Zealand Food Composition Database terms of use — New Zealand Food Composition Database
General information only. Not personalised nutrition or medical advice.
Spotted something wrong? Corrections are welcome — email editorial@proteinnotes.com. How this page was researched is set out in our editorial standards.